Jconsole
Ability to monitor Live application is a costly process. JBoss offers some out of the box tools to monitor the same. One of the tools we are very familiar with is jconsole, this comes bundled with Java JBOSS_HOME/bin and can be used to access the JVM running the server instance. Use Remote Process Option to connect and the connection string looks like: service:jmx:remoting-jmx://my_app_url:9999 The default port is 9999 unless u have port offet in place in which case you would have to add the offset.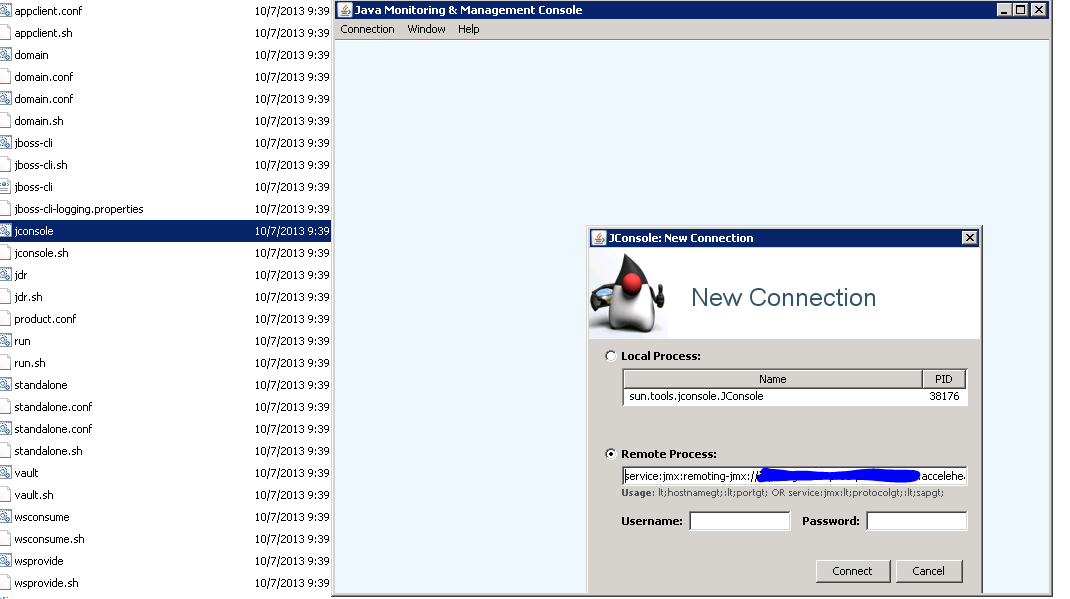

This was crashing the application as it was not able to clear old gen space. Moreover the new G1 Garbage Collector doesnt do its job as well as the older GC.
A stable app VM arguments looks like:
-XX:+UseCompressedOops -Dprogram.name=standalone.bat -Xms1G -Xmx4G -XX:MaxPermSize=512M -XX:+UseConcMarkSweepGC -Djava.net.preferIPv4Stack=true -Djboss.modules.system.pkgs=org.jbos88,server=y,suspend=n -XX:+HeapDumpOnOutOfMemoryError -XX:HeapDumpPath=heap_dump/myapp -Dorg.jboss.boot.log.file=D:\JBOSS6.2\myapp log\server.log
- +UseConcMarkSweepGC does a much better job in clearing old gen space periodically.
- +HeapDumpOnOutOfMemoryError along with HeapDumpPath dumps heap for analysis in case of JVM crashes with out of memory exception.
Heap Dump Analysis
If your application is frequntly running out of memory or you suspect memory leaks, you could either wait for the application to crash and generate heap dumps for you(provided u have given the VM arguments saying so), You can use the jconsole to generate heap dumps at any point if you need them for analysis.
Once you have the dump you could use anlaysis tool to look further.
One such tool available is from eclipse community:
Eclipse Memory Analyzer (MAT) This tool will help us identify any leak suspects:
